We’ve poured countless hours into building, refining, and improving our mattress testing process and scoring system. Our system is designed to create a clear and fair quantitative assessment for mattresses.
Using our scores as a guideline you can quickly and easily identify the mattresses that are best for you.
Below we’re going factor-by-factor so you can see exactly how we test and score mattresses.
Table Contents
Scoring Factors | Understanding Our Scores | Scoring Methodology | Durability | Cooling | Sinkage | Motion Transfer | Response Time | Bounce | Edge Support | Sex | Pressure Relief | Off-Gassing | Company | Foam Density | Coil Gauge | Kid’s Scoring | Errors & Corrections
Scoring Factors
Our overall score is based on a weighted average of 8 scoring factors.
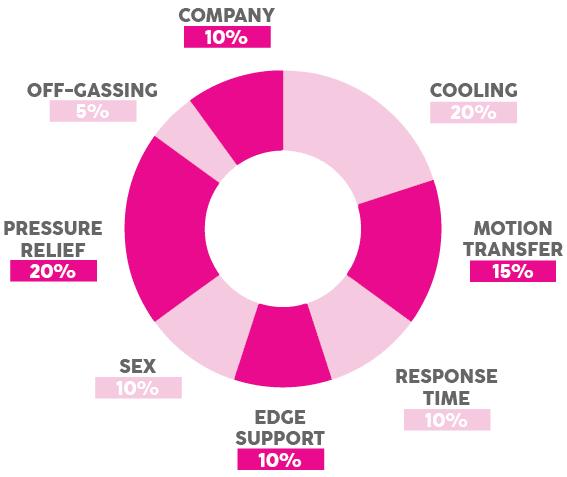
Each factor is given a weight based on the level of importance, which we combine together to determine the total score. Our individual factors are rounded up to one decimal place. Our overall mattress scores are rounded up to the second decimal place.
In addition, we also score durability tests. However, the durability score is not currently included within our overall score. In the future, we plan to include durability tests in the overall score once we have more data.
Non-Scoring Tests
In addition, we also test and analyze sinkage, bounce, foam density, and coil gauge (wire thickness).
Sinkage & Bounce
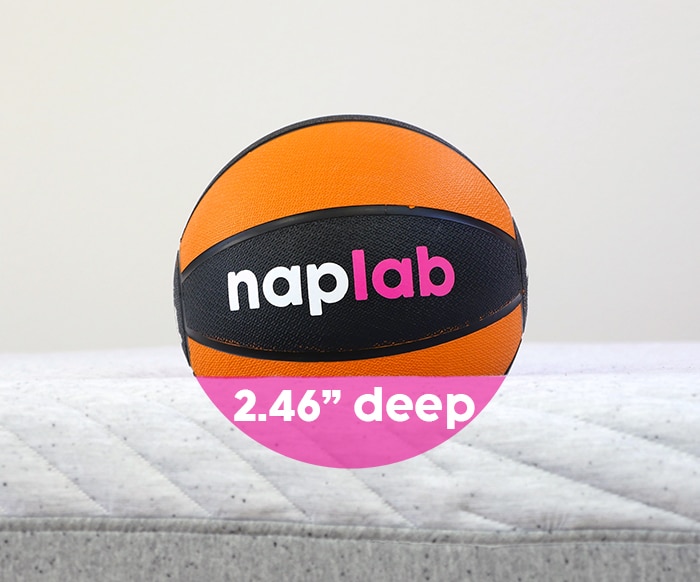
First, let’s talk through sinkage and bounce. The objective measurements for sinkage and bounce are rounded up to two decimal places.
Casper Dream Max

Leesa Reserve
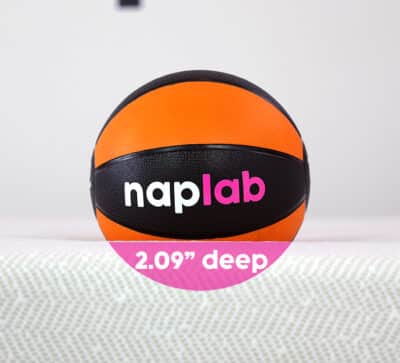
While we think bounce and sinkage are relevant and important to test and discuss, these are not scoring factors, as they are highly preferential. Some sleepers love deep sinkage, some love minimal sinkage. Being one or the other doesn’t make one inherently better or worse. The same can be said of bounce (except as it relates to sex performance, where we do use it as 1 of 5 factors to determine the sex score).
Foam Density & Coil Gauges
For foam density we use an electronic densimeter that provides a precise measurement of foam density in PCF (pounds per cubic feet).
Foams that are more dense are typically higher quality, last longer, perform better, and sag less. While foam density measurement is a useful data point as part of our larger analysis, it is not currently a scoring factor.
For coil gauge we use a digital caliper to measure the thickness of the coil wires used in the coil units. Our digital caliper has a resolution of 0.0005″ / 0.0127 mm. Once we’ve taken a caliper measurement we then convert that to a coil gauge.
Coils that use a thicker wire (which is a lower gauge number) typically provide better support, durability, and longevity. However, there are other relevant factors including number of coil turns, intended firmness level, coil placement (edge vs. center vs. zoning), steel quality, number of coils, and coil diameter, among other coil attributes that impact performance. While coil gauge is a useful data point as part of our larger analysis, it is not currently a scoring factor.
Lastly, many brands have also sent NapLab their exact foam densities, ILD (indentation load deflection; a measure of firmness) ratings, and coil gauges. Any time we have this data we publish it within the review.
Understanding Our Scores
We use a 1-10 point grading scale. The more points a mattress scores in any given criteria, the better its performance is going to be.
10
Outstanding Score
9.0 – 9.9
Excellent Score
8.0 – 8.9
Good Score
7.0 – 7.9
Fair Score
6.0 – 6.9
Mediocre Score
5.0 – 5.9
Poor Score
4.0 – 4.9
Terrible Score
Scores below a 4.0 are increasing degrees of “Terrible”.
Scoring Methodology
Over time, we may find ways to improve our testing process, adjust scoring criteria, add / remove / revise scoring factors, and make other changes. These adjustments are designed to help ensure our scores create the most accurate and helpful mattress recommendations.
Our current scoring methodology is version 1.3.
If / when we update our scoring methodology we may also update mattress reviews at that time. At the top of all mattress review pages you’ll find the current scoring methodology which that mattress was tested under.
Below is a list of the major changes and updates to our scoring system from version 1.2 to version 1.3.
Why Did We Make These Changes?
We are always looking for ways to improve our reviews. Our 1.3 scoring update was aimed at streamlining our data, improving the clarity and aesthetics of our charts and graphs, and simplifying our company score.
General Changes
- Data Set for Averaging Data – in our 1.2 and earlier scoring systems we considered all data from all mattresses tested to date to determine the average score for our various data points (ex. average sinkage depth, average motion transfer acceleration range, average mattress thickness, etc.). In scoring system 1.3 we moved to only assessing the testing data from mattresses currently available for sale. Otherwise put, we no longer consider discontinued mattresses in determining average data points. Removing said discontinued mattress data resulted in relatively minor changes to the average data calculations (ex. average sinkage depth moved from 2.18″ to 2.21″). This change did not impact any of our scores. Notably, most pages / videos will not be updated to the new data set for averaging. All new content and dynamic content will use the new data set immediately.
Updated Scoring Factors
- Cooling – We updated our cooling chart to improve the visual aesthetic and data clarity.
- Motion Transfer – We updated our motion transfer chart to improve the visual aesthetic and data clarity.
- Motion Transfer – We added a new testing variable for “motion duration”. Motion duration is the total elapsed time it takes for the mattress to return to near zero levels of acceleration after the medicine ball drop during our tests. Motion duration is a testing variable we’ve been calculating, analyzing, and discussing for a while. This change simply establishes it as a permanent testing variable and allows us to more easily determine the average motion duration score, which will further improve our analysis. This change did not impact the motion transfer score.
- Company – We removed Trust as a scoring factor. This change did impact the company score, which also impacted the overall score for all mattresses we’ve tested to date.
- Company – We adjusted the scoring weight of the 4 remaining factors within the company score to absorb the scoring weight of the Trust factor (50%). The following are the adjusted scoring weights: Returns 40% (+20%), Trial Period 30% (+15%), Warranty 20% (+10%), and Shipping 10% (+5%). This change did impact the company score, which also impacted the overall score for all mattresses we’ve tested to date.
Updated Non-Scoring Factors
- In May 2026 we added tests and data for durability, foam density, and coil gauge. None of these factors are currently used as part of the overall mattress score. However, these factors are useful as part of our larger mattress analysis.
You can find information on our legacy scoring systems below:
- Scoring System 1.2 – April 2024 to July 2025
- Scoring System 1.1 – September 2021 to April 2024
- Scoring System 1.0 – August 2021 to September 2021
Linear Function Score Calculations
We use linear functions to determine scores for motion transfer, response time, edge support, bounce (sex sub-factor), and off-gassing.
The linear functions were found using two points on the line, where the x-axis (input) represents the mattress performance data and the y-axis (output) represents the score rounded to the nearest tenth.
For simplicity, we rounded the slope and the y-intercept to the decimal places shown in the score tables below.
On the right side of each table below, we have indicated all input values that when plugged into the function and then rounded to the nearest tenth would result in the scores on the left side of each table below.
Durability
Our durability score is an objective score that assesses how mattresses sag (height loss and sinkage gain) and soften (firmness loss) over time. To gather the data for our durability score we conduct a mattress rollator test using ASTM F1566.
This is the industry standard for testing durability on mattresses within the United States and it’s the same testing protocol used by virtually every major mattress company in the US.
Our testing process includes the following steps:
- Measure the height of the mattress
- Measure the hardness (aka firmness) of the mattress
- Run a rollator (the larger wooden roller) 100,000 times across the middle of the mattress (a process which takes around 5 days). This simulates 10 years of use on the mattress.
- Measure the height of the mattress
- Measure the hardness of the mattress
The primary data points we collect and analyze include:
- Height Loss – This is how much height a mattress loses after the accelerated 10 year test. We measure height loss as an absolute number and a percentage of height loss. Mattresses with less height loss are better.
- Sinkage Gain – This is how much sinkage into the mattress is allowed using a consistent force level (778N). We measure sinkage gain as an absolute number and a percentage of sinkage change. Mattresses with less sinkage gain are better.
- Firmness Loss – This is how much softer the mattress is after the accelerated 10 year test. We measure firmness loss as a quotient (778N divided by sinkage depth in mm) and as a percentage of firmness loss. Mattresses with less firmness loss are better.
Our durability score is a weighted score. 33.33% of the score comes from height loss, 33.33% of the score comes from sinkage gain, and 33.33% of the score comes from firmness loss.

Here’s the scale we use to determine the height loss score:
10
height loss % ≤ 0.05 %
9.0 – 9.9
0.05 % < height loss % ≤ 1.05 %
8.0 – 8.9
1.05 % < height loss % ≤ 2.05 %
7.0 – 7.9
2.05 % < height loss % ≤ 3.05 %
6.0 – 6.9
3.05 % < height loss % ≤ 4.05 %
5.0 – 5.9
4.05 % < height loss % ≤ 5.05 %
4.0 – 4.9
5.05 % < height loss % ≤ 6.05 %
Linear Function
f(x) = -100x + 10
What It Means
For every 1 percent above 0 percent(s), 1 point is deducted from the value.
Here’s the scale we use to determine the sinkage gain score:
10
sinkage gain % ≤ 0.125 %
9.0 – 9.9
0.125 % < sinkage gain % ≤ 2.625 %
8.0 – 8.9
2.625 % < sinkage gain % ≤ 5.125 %
7.0 – 7.9
5.125 % < sinkage gain % ≤ 7.625 %
6.0 – 6.9
7.625 % < sinkage gain % ≤ 10.125 %
5.0 – 5.9
10.125 % < sinkage gain % ≤ 12.625 %
4.0 – 4.9
12.625 % < sinkage gain % ≤ 15.125 %
Linear Function
f(x) = -40x + 10
What It Means
For every 1 percent above 0 percent(s), 0.4 points are deducted from the value.
And here’s the scale we use to determine the firmness loss score:
10
firmness loss % ≤ 0.125 %
9.0 – 9.9
0.125 % < firmness loss % ≤ 2.625 %
8.0 – 8.9
2.625 % < firmness loss % ≤ 5.125 %
7.0 – 7.9
5.125 % < firmness loss % ≤ 7.625 %
6.0 – 6.9
7.625 % < firmness loss % ≤ 10.125 %
5.0 – 5.9
10.125 % < firmness loss % ≤ 12.625 %
4.0 – 4.9
12.625 % < firmness loss % ≤ 15.125 %
Linear Function
f(x) = -40x + 10
What It Means
For every 1 percent above 0 percent(s), 0.4 points are deducted from the value.
Regarding the ASTM F1566 testing standard – we aim to follow the testing protocols as precisely as possible. However, there are some testing protocols that we are unfortunately unable to follow (or are choosing not too). Due to the way ASTM aggressively defends their copyright we are not able to discuss the specific requirements that we’re not following. While I don’t think ASTM would sue us for talking about those requirements, I’m also not 100% certain that they would not. In any case, I don’t believe any of the F1566 requirements that we’re not following will meaningfully impact the results.
NapLab is not endorsed by, certified by, or otherwise affiliated with ASTM in any way.
Cooling
Our cooling score is a subjective assessment based on:
- Mattress materials
- Mattress design
- Sinkage depth
- Objective data from our cooling test
- Subjective experience during our cooling test
Whether or not a mattress sleeps cool is highly subjective, as there are numerous factors that impact cooling performance. Our cooling score looks at the overall cooling picture, including objective temperature measurements, and we provide a score based on that overall view.
Below are the specifics we’re looking at when making our assessment.
Mattress Materials
What is the mattress made out of? Is it using traditional heat reactive memory foam or a more modern foam formulation? Does the foam have additives that could improve cooling like gel or copper?
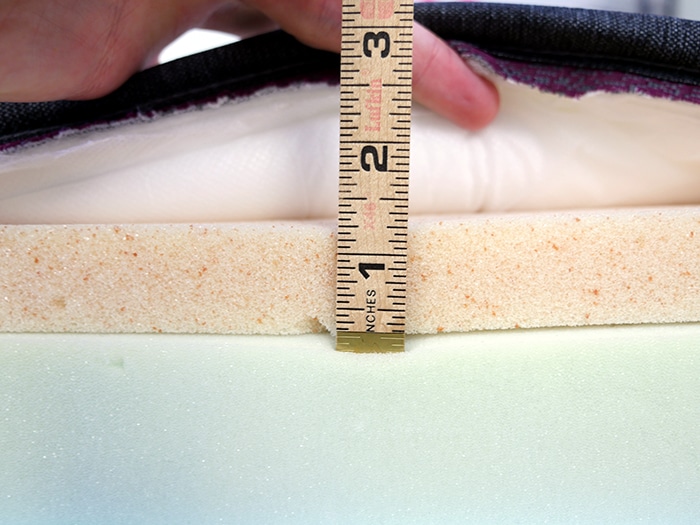
Is a cooler foam like latex or a latex-like poly foam used as opposed to memory foam? How thick are the comfort layers?
Does the mattress use a cooling cover? How long does that cover stay cool? And how cool is it at its maximum coolness?
The specific materials used within the mattress make a significant impact on how cool the mattress will be.
Mattress Design
Is it a memory foam mattress? Combo foam? All foam? Hybrid? Coil-on-Coil? Each mattress design type performs better or worse for cooling.
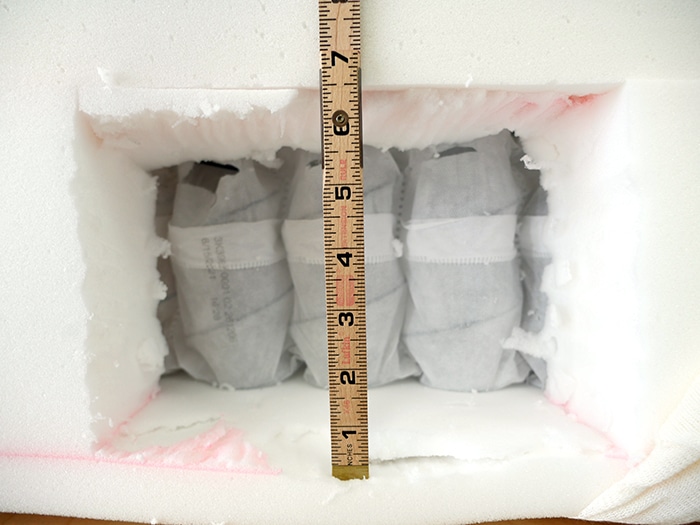
Does the mattress design incorporate elements that enhance breathability, for example, airflow channels cut within the foams? Aeration holes within the foam? Placing memory foam or other warmer materials further away from sleepers?
The mattress design elements greatly impact cooling performance.
Sinkage Depth
How deep do sleepers sink and how much hug and contour is placed on the body? The deeper you are the more material is physically touching and wrapping around your body, which can exacerbate heating issues.
Objective Data
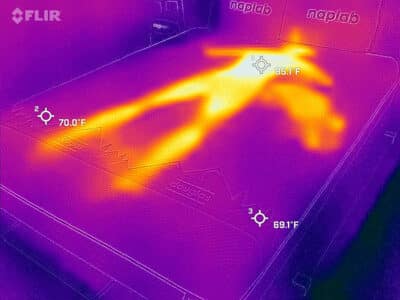
Our cooling test uses a thermal camera to get precise surface level temperatures on the mattress. To complete this test we start by taking a thermal image before anyone lies on the mattress.
Max Temp.
Ending Temp
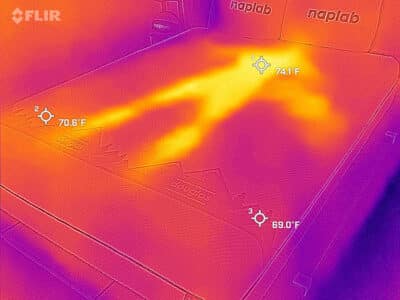
Next, we lie on the mattress for 15 minutes, allowing it to absorb our body heat. Finally, we get up from the mattress and take thermal photos at 6 different time markers (0, 1, 2, 3, 4, and 5 minutes).
We analyze this data to bring an objective data point into our overall score.
Here’s the scale we use to determine cooling scores:
10
Outstanding Cooling Score
9.0 – 9.9
Excellent Cooling Score
8.0 – 8.9
Good Cooling Score
7.0 – 7.9
Fair Cooling Score
6.0 – 6.9
Mediocre Cooling Score
5.0 – 5.9
Poor Cooling Score
4.0 – 4.9
Terrible Cooling Score
Sinkage
Our sinkage test is an objective measurement of pressure point sinkage. To test sinkage, we take our standard 12 pound medicine ball and place it in the middle of the mattress, approximately 12 inches away from the edge of the mattress.
We place it away from the edge so that we can avoid any reinforced edge coils / support foam, as we want to measure typical mattress sinkage, not edge sinkage.
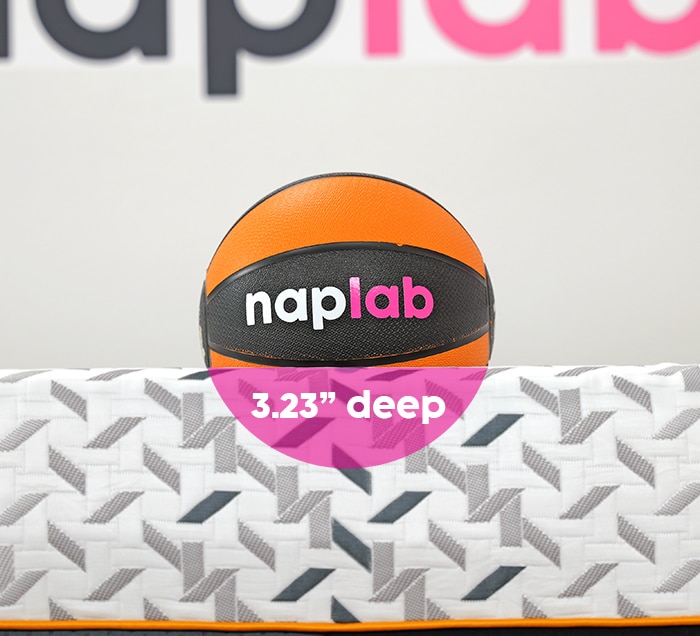
To measure sinkage, we take a photograph of the medicine ball on the mattress. We then use Adobe Photoshop to measure the number of pixels that are not visible (because they are hidden by the sunken medicine ball). We then take that number of pixels and divide them by the total pixel count of the medicine ball, before multiplying by the total height of the medicine ball (which is 9.5″).
This allows us to get a precise measurement of sinkage on the mattress.
Extremely Deep
Sinkage ≥ 2.89 inches
Very Deep
2.59 inches ≤ sinkage < 2.89 inches
Deep
2.29 inches ≤ sinkage < 2.59 inches
Moderate
1.99 inches ≤ sinkage < 2.29 inches
Minimal
1.69 inches ≤ sinkage < 1.99 inches
Very Minimal
1.39 inches ≤ sinkage < 1.69 inches
Extremely Minimal
1.09 inches ≤ sinkage < 1.39 inches
Our sinkage measurement does not translate into a score. This is because more / less sinkage isn’t necessarily better or worse. Sinkage is highly preferential, some sleepers prefer more, others less.
In general, side sleepers tend to prefer more sinkage, while back and stomach sleepers tend to prefer less.
While we do not score sinkage, we do provide a consistent description based on the objective sinkage depth (see the chart above). We provide these descriptions to help make it easier to understand and compare different mattress models.
Motion Transfer
Our motion transfer score is an objective score that uses accelerometer data to precisely measure motion. To complete our motion transfer tests we place our accelerometer on one side of the mattress and drop a 12 pound medicine ball on the other side.
Acceleration is measured in meters per second squared (m/s2). If an object (in this case our accelerometer) accelerates in 5.0 m/s2 that means the speed is increasing by 5.0 meters every second. The higher the acceleration, the more motion is created on the mattress.
The initial medicine ball drop and rebound creates an acceleration range (IE, a minimum and maximum acceleration), which are the data points we use for our scores.
Here’s the scale we use to determine motion transfer scores:
10
Acceleration range ≤ 5.11 m/s²
9.0 – 9.9
5.11 m/s² < acceleration range ≤ 7.33 m/s²
8.0 – 8.9
7.33 m/s² < acceleration range ≤ 9.55 m/s²
7.0 – 7.9
9.55 m/s² < acceleration range ≤ 11.77 m/s²
6.0 – 6.9
11.77 m/s² < acceleration range ≤ 14.00 m/s²
5.0 – 5.9
14.00 m/s² < acceleration range ≤ 16.22 m/s²
4.0 – 4.9
16.22 m/s² < acceleration range ≤ 18.44 m/s²
Linear Function
f(x)=-0.45x+12.25
What It Means
For every 1.0 m/s² above 5.0 m/s²(s), 0.45 points are lost.
In addition, we also collect data on the motion duration, which is the elapsed time between motion beginning and motion returned to near zero levels. However, motion duration does not impact the motion transfer score.
Response Time
Mattresses with a faster response time allow for easier movement of sleepers.
Response time is the amount of time it takes for a mattress to release its materials and respond back to its original shape. Memory foam mattresses tend to offer slower response time, which can leave some sleepers feeling stuck.
Our response time score is an objective score.
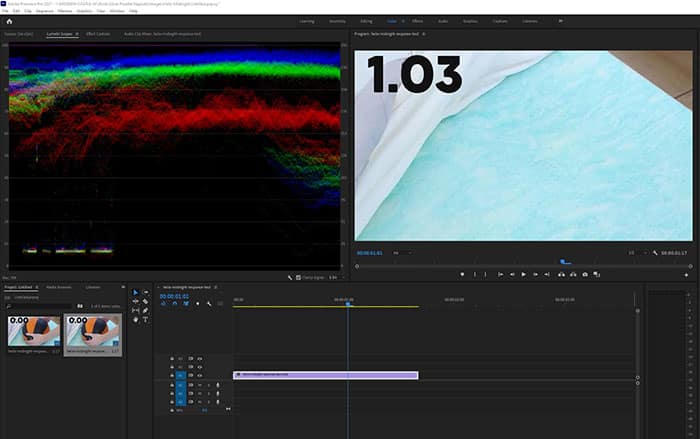
To test response time we place a 12 pound medicine ball on the mattress. Once it’s fully at rest we quickly remove the medicine ball. We record the process using a high FPS camera, overlay a stop watch, and then go frame-by-frame to assess exactly how long the mattress takes to recover.
On many mattresses, they will be mostly recovered fairly quickly, while a complete recovery of all foams can take longer. Mostly recovered to us means about 80%. I say “about” because this is a subjective determination based on our analysis of the video footage.
In addition, we also measure the fully recovered response time. Our response time score is a weighted score. 70% of the score comes from mostly recovered time and 30% of the score comes from the fully recovered response time.

Here’s the scale we use to determine the mostly recovered score.
10
Response time ≤ 0.20 seconds
9.0 – 9.9
0.20 seconds < response time ≤ 0.36 seconds
8.0 – 8.9
0.36 seconds < response time ≤ 0.52 seconds
7.0 – 7.9
0.52 seconds < response time ≤ 0.68 seconds
6.0 – 6.9
0.68 seconds < response time ≤ 0.84 seconds
5.0 – 5.9
0.84 seconds < response time ≤ 1.00 seconds
4.0 – 4.9
1.00 seconds < response time ≤ 1.16 seconds
Linear Function
f(x)=-6.25x+11.25
What It Means
For every 1.0 seconds above 0.2 seconds, 6.25 points are lost.
And here’s the scale we use to determine the fully recovered score.
10
Response time ≤ 0.31 seconds
9.0 – 9.9
0.31 seconds < response time ≤ 0.65 seconds
8.0 – 8.9
0.65 seconds < response time ≤ 0.99 seconds
7.0 – 7.9
0.99 seconds < response time ≤ 1.33 seconds
6.0 – 6.9
1.33 seconds < response time ≤ 1.67 seconds
5.0 – 5.9
1.67 seconds < response time ≤ 2.01 seconds
4.0 – 4.9
2.01 seconds < response time ≤ 2.35 seconds
Linear Function
f(x)=-2.941x+10.882
What It Means
For every 1.0 seconds above 0.3 seconds, 2.94 points are lost.
Scoring Floor
The overall response time score, mostly recovered score, and fully recovered score have a scoring floor of 5.0. This simply means that the worst score that will ever be given will be a 5.0.
Bounce
Our bounce test is an objective measurement of the total bounce height on the mattress. To test bounce, we take our standard 12 pound medicine ball and drop it from a height of 18″ above the surface of the mattress. We drop the ball away from the edge so as to avoid any reinforced edge coils or edge support foam.
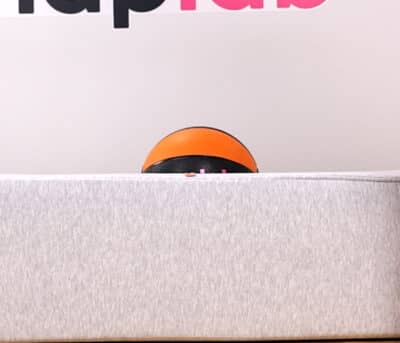
To measure bounce, we record a video clip of the bounce drop. We then take a screenshot of the medicine ball when it reaches its maximum sinkage depth. We also take a screenshot of the medicine ball when it reaches its maximum bounce height.
Max. Sinkage Depth
Max. Bounce Height
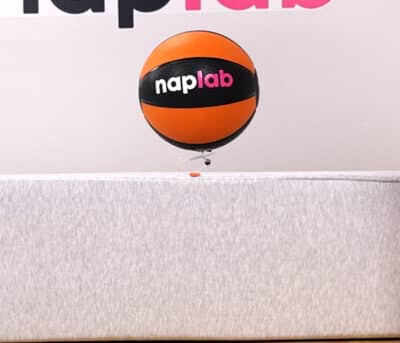
To measure maximum sinkage depth:
We use Adobe Photoshop to measure the number of pixels that are not visible (because they are hidden by the sunken medicine ball). We then take that number of pixels and divide them by the total pixel count of the medicine ball, before multiplying by the total height of the medicine ball (which is 9.5″).
To measure maximum bounce height:
We use Adobe Photoshop to measure the number of pixels between the bottom of the medicine ball and the surface level of the mattress. We then take that number of pixels and divide them by the total pixel count of the medicine ball, before multiplying by the total height of the medicine ball (which is 9.5″).
To measure total bounce height:
Our total bounce height is the sum of the maximum sinkage depth (how deep the ball sinks into the mattress) and the maximum bounce height (how high the ball rebounds above the surface of the mattress).
Extremely Low
Bounce ≤ 4.10 inches
Very Low
4.10 inches < bounce ≤ 6.10 inches
Low
6.10 inches < bounce ≤ 8.10 inches
Moderate
8.10 inches < bounce ≤ 10.10 inches
High
10.10 inches < bounce ≤ 12.10 inches
Very High
12.10 inches < bounce ≤ 14.10 inches
Extremely High
14.10 inches < bounce ≤ 16.10 inches
Our bounce measurement does not translate into a score. This is because more / less bounce isn’t necessarily better or worse. Bounce is highly preferential, some sleepers prefer more, others less (however, more bounce is better for sex, so bounce is a sub-factor in our sex score).
While we do not score bounce, we do provide a consistent description based on the objective total bounce height (see the chart above). We provide these descriptions to help make it easier to understand and compare different mattress models.
Edge Support
Whether you sleep next to, sit near, or have sex on, edge support in a mattress is important. To test edge support we sit directly on the edge of the mattress. Using a yard stick and high resolution photographs, we analyze photos to get a precise measurement of the level of compression on the edge.
Sitting, 140 lbs.

Sitting, 200 lbs.
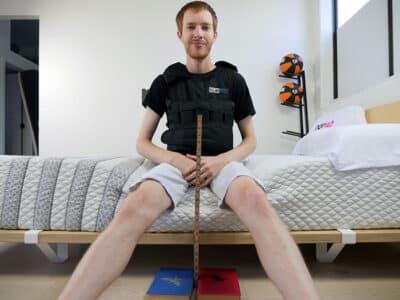
In addition, we lie directly on the edge of the mattress to determine a subjective rating for lying edge support performance.
Our edge support score is based on how deep the mattress sinks while sitting directly on the edge of the mattress and how supportive the mattress feels while lying directly on the edge. The total edge support score is weighted with 50% of the score coming from sitting edge support and 50% of the score coming from the lying edge support tests.

Here’s the scale we use to determine sitting edge support scores:
10
Sitting sinkage ≤ 3.04 inches
9.0 – 9.9
3.04 inches < sitting sinkage ≤ 3.84 inches
8.0 – 8.9
3.84 inches < sitting sinkage ≤ 4.64 inches
7.0 – 7.9
4.64 inches < sitting sinkage ≤ 5.44 inches
6.0 – 6.9
5.44 inches < sitting sinkage ≤ 6.24 inches
5.0 – 5.9
6.24 inches < sitting sinkage ≤ 7.04 inches
4.0 – 4.9
7.04 inches < sitting sinkage ≤ 7.84 inches
Linear Function
f(x)=-1.25x+13.75
What It Means
For every 1.0 inch above 3 inches, 1.25 points are lost.
And here’s the scale we use to determine lying edge support scores:
10
Outstanding lying support
9.0 – 9.9
Excellent lying support
8.0 – 8.9
Good lying support
7.0 – 7.9
Fair lying support
6.0 – 6.9
Mediocre lying support
5.0 – 5.9
Poor lying support
4.0 – 4.9
Terrible lying support
Sex
In addition to sleep, sex on the mattress is incredibly important to many. Certain mattress types, mattress designs, and material types may work with or against you when it comes to sex.
Our sex score is a simple equation where we look at 5 different factors. Each factor is given a specific weight based on how important we think that factor is for most people.
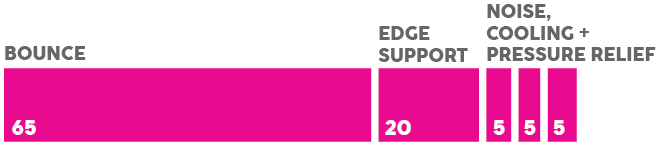
Our sex equation considers bounce, sitting edge support, pressure relief, cooling, and noise. Click the links above for more information on how we test for and determine the scores for those categories.
Below is our sex performance scoring scale:
10
Outstanding sex performance
9.0 – 9.9
Excellent sex performance
8.0 – 8.9
Good sex performance
7.0 – 7.9
Fair sex performance
6.0 – 6.9
Mediocre sex performance
5.0 – 5.9
Poor sex performance
4.0 – 4.9
Terrible sex performance
Sex Bounce
While we do specifically look at bounce as a separate test, the way we analyze bounce for general purpose sleeping doesn’t align well to sex performance. While tons of bounce isn’t always great for sleep, it’s almost always preferable for sex.
As a result, we use the same data from our bounce test, but with a scale specific to sex. Our sex bounce scale rewards more points for mattresses that have more bounce.
Below is our sex bounce scale:
10
Bounce ≥ 11.93 inches
9.0 – 9.9
10.34 inches ≤ bounce < 11.93 inches
8.0 – 8.9
8.75 inches ≤ bounce < 10.34 inches
7.0 – 7.9
7.16 inches ≤ bounce < 8.75 inches
6.0 – 6.9
5.58 inches ≤ bounce < 7.16 inches
5.0 – 5.9
3.99 inches ≤ bounce < 5.58 inches
4.0 – 4.9
2.40 inches ≤ bounce < 3.99 inches
Linear Function
f(x)=0.63x+2.44
What It Means
For every 1.0 inch below 12 inches, 0.63 points are lost.
Scoring Floor
The sex bounce score has a scoring floor of 5.0. This simply means that the worst score that will ever be given will be a 5.0.
Noise
To test noise, we jump on the mattress to determine how loud it is while under significant pressure. Our rating for noise is a subjective assessment.
Below is our sex noise scale:
10
Minimal noise
8.0
Moderate noise
6.0
High noise
4.0
Very high noise
Pressure Relief
When you lie on a good mattress you won’t experience any significant pressure points on your body. Mattresses that are too firm or too soft, not thick enough, lacking in comfort materials, sinking too much / too little, and / or using poor quality materials all have the potential to create pressure points.
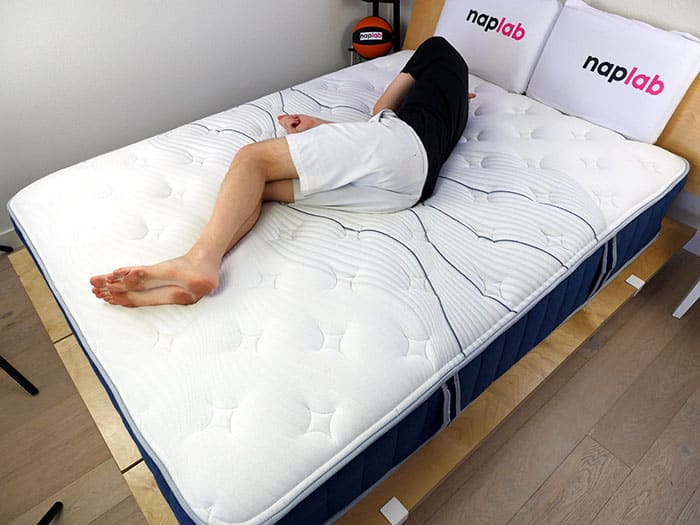
Objectively measuring pressure relief is impossible, in our view. As a result, we choose to make a subjective assessment of pressure relief based on our experience testing the product, material quality, comfort layer thickness, support layer thickness, total mattress thickness, material types, mattress design, objective pressure mapping data, sinkage, contour, cover type, and other factors.
Beginning April 2024, we began including pressure mapping data and visual pressure mapping images. We use a highly advanced pressure mapping system to create these maps. These data and images provide an objective data point that helps inform our subjective pressure relief ratings.

Here’s the scale we use to determine pressure relief scores:
10
Outstanding pressure relief
9.0 – 9.9
Excellent pressure relief
8.0 – 8.9
Good pressure relief
7.0 – 7.9
Fair pressure relief
6.0 – 6.9
Mediocre pressure relief
5.0 – 5.9
Poor pressure relief
4.0 – 4.9
Terrible pressure relief
Off-Gassing
Off-gassing is the release of a gas that was trapped within a material. You can also think of this as the mattress smell. In many cases, mattresses (especially those that contain foam) have a strong smell when new.
Depending on the materials, construction, quality, and other factors, that smell may be gone within a few hours or it may take many months.
Our off-gassing score is a subjective assessment based on the period of time it takes for any strong smell to fully dissipate.
Here’s the scale we use to determine off-gassing scores:
10
Off-gassing time ≤ 0.17 days
9.0 – 9.9
0.17 days < off-gassing time ≤ 3.77 days
8.0 – 8.9
3.77 days < off-gassing time ≤ 7.37 days
7.0 – 7.9
7.37 days < off-gassing time ≤ 10.97 days
6.0 – 6.9
10.97 days < off-gassing time ≤ 14.56 days
5.0 – 5.9
14.56 days < off-gassing time ≤ 18.16 days
4.0 – 4.9
18.16 days < off-gassing time ≤ 21.76 days
Linear Function
f(x)=-0.278x+10
What It Means
For every 1 day above 0 days, 0.278 points are lost.
Company
Our company score looks at 4 factors that we think reflect the most critical company policies, customer service, and customer experience.
Factors We Consider
- Returns
- Trial Period
- Warranty
- Shipping
These 4 factors are given a specific weight based on how important we think that factor is.

Returns
In our view, the most critical factor for returns is whether or not they are free. Not having to pay for a return / refund is always better than having to pay something.
The return score uses a tiered scoring system (non-linear).
10
$0 returns
9.0
$1-25 returns
8.0
$26-50 returns
7.0
$51-100 returns
6.0
$101-150 returns
5.0
$150+ returns
0.0
No returns or very limited returns
Trial Period
How long is the trial period? The longer the trial period the better, as it provides sleepers with more time to make a decision on whether or not that mattress is the right choice.
The trial period score uses a tiered scoring system (non-linear).
10
180+ nights
8.0
100-179 nights
6.0
30-99 nights
0.0
0-29 nights
Warranty
A longer warranty is almost always better than a shorter warranty. Mattresses with longer warranties earn more points.
The warranty score uses a tiered scoring system (non-linear).
10
25+ years
8.0
10-24 years
0.0
0-9 years
Shipping
In our view, the most critical factor for shipping is whether or not it’s free. Paying less for shipping is always better than paying more for shipping.
The shipping score uses a tiered scoring system (non-linear).
10
$0 shipping
9.0
$1-25 shipping
8.0
$26-50 shipping
7.0
$51-75 shipping
6.0
$76-100 shipping
5.0
$101-150 shipping
4.0
$151+ shipping
Country of Origin
Additionally, we include information on the country of origin where the mattress was manufactured. However, we do not use this as a data point to score.
Some users may find this information helpful, while others may find it irrelevant. We include the data point so you have the information in the event it’s a factor that’s important to you.
Foam Density
Our foam density test uses an electronic foam densimeter to measure the density of foam layers in PCF (pounds per cubic feet). To gather the density data, we calculate volume using water displacement, also known as Archimedes’ principle. Furthermore, we follow the saturation density testing method to account for the porous nature of foam material.
Below is the mathematical formula used in this method for calculating density. Here, volume is represented by the mass of the displaced water.
By using this approach, we bypass the need for precisely cutting geometric samples to achieve an accurate volume measurement.
Our testing process includes the following steps:
- Collect a foam sample of approximately 0.5 – 1.5 grams, ensuring it is free of adhesives, debris, or other contaminants.
- Weigh the foam sample in a normal (dry) state.
- Saturate the foam sample completely in distilled water to avoid absorption in step 5.
- Weigh the foam sample in its saturated (wet) state.
- Submerge the saturated foam sample in the densimeter water tank to get the weight of the submerged sample.
- Calculate the density of the foam by dividing its dry mass (step 2) by the weight of the water displaced, which is calculated as the difference between the saturated and submerged masses (steps 4 and 5).
The primary data point we collect and analyze is foam density:
- Foam Density – This is how dense or heavy a particular piece of foam is (measured in pounds per cubic feet, PCF). Foams that are more dense have more foam material in them. Two foam layers can look the same, sound the same, and be the same thickness, but also have different densities and foam formulations, causing their performance to differ dramatically. Foam quality exists on a spectrum of performance. Higher density foams typically last long, perform better, are higher quality, and sag less.
The rating scales below provide a general guideline on the quality levels of different types of foam and their respective densities.
Poly Foam
Outstanding
≥ 3.0 PCF
Excellent
2.5-2.9 PCF
Good
2.0-2.4 PCF
Fair
1.5-1.9 PCF
Mediocre
1.2-1.4 PCF
Poor
1.0-1.2 PCF
Terrible
< 1.0 PCF
Memory Foam
Outstanding
≥ 6.0 PCF
Excellent
4.0-5.9 PCF
Good
3.0-3.9 PCF
Fair
2.5-2.9 PCF
Mediocre
2.2-2.4 PCF
Poor
2.0-2.1 PCF
Terrible
< 2.0 PCF
Latex
Latex is a notably denser / heavier foam compared to most poly and memory foam, as a result, PCF is considerably higher. PCF is not often used as a measure for latex, instead, you’ll more often see ILD (indentation load deflection), which is a measure of firmness. In any case, we still make a point to measure latex in PCF for consistency in our testing.
Outstanding
≥ 5.5 PCF
Excellent
5.0-5.4 PCF
Good
4.5-4.9 PCF
Fair
4.0-4.4 PCF
Mediocre
3.5-3.9 PCF
Poor
3.0-3.4 PCF
Terrible
< 3.0 PCF
Testing Limitations
Our density tests are subject to a number of testing limitations, potential sources of measurement error, and variability that may influence our results. These are the biggest testing limitations as we see them:
- We make an error in testing – the testing steps are incredibly precise and small errors in the testing process could result in foam densities that are inaccurate. In our preparations for beginning formal testing, we tested 15 foam samples with known densities. Our measurements on average came within 6.5% of the known / stated manufacturer density.
- Variance in surface tension – water “clings” to foam differently after saturating it, due to surface tension, which varies from foam to foam. Treatment with cooling gels, phase change materials, or other hydrophobic coatings can introduce a small margin of error.
- Foams are not always consistent – foams are typically manufactured in large buns and then cut into smaller layers. While the bun on average may be a certain density, individual foam layers that have been cut from that bun may be slightly more or less dense than the overall foam bun average.
- Limited sample size – we are testing a single mattress and it’s always possible that the sample size of one is not an accurate reflection of the typical mattress made by that brand.

- Glue layers – while we make every effort to remove as much glue as possible from the foam layers, there still may be some glue residue on the foams that are increasing the weight.
- Bubbles on samples – some foams are more prone to collecting bubbles around the sample as it is submerged in the densimeter tank. This can throw off measurements as it erroneously provides extra buoyancy to the sample.
- Foam Expansion – certain foams tend to expand significantly when saturated with water. This makes the Archimedes principle and the saturation method unsuitable for measuring density. In these cases, we rely on measuring the volume of the dry foam sample using digital calipers and taking the dry weight on the densimeter. This uses the basic formula for density: mass divided by volume.
Coil Gauge
Our coil gauge test uses a digital caliper to precisely measure the width of the wire thickness used in mattress coil units. Our digital caliper has a resolution of 0.0005″ / 0.0127 mm. Once we’ve taken a caliper measurement we then convert that to a coil gauge.
Our testing process includes the following steps:
- Collect a sample of at least 3-5″ of coil from mattress
- Ensure the sample is free of adhesives, unavoidable kinks, and other debris that would make the coil less uniform
- Use digital calipers to take two measurements perpendicular across the coil sample
- Average those measurements together and reference the Washburn & Moen conversion chart to get the steel gauge number
Washburn & Moen Standard For Converting Steel Coil
| W&M Gauge | Thickness (Inches) | Thickness (mm) |
|---|---|---|
| 12 | 0.1055″ | 2.68 mm |
| 12.5 | 0.0985″ | 2.50 mm |
| 13 | 0.0915″ | 2.32 mm |
| 13.5 | 0.0860″ | 2.18 mm |
| 14 | 0.0800″ | 2.03 mm |
| 14.5 | 0.0760″ | 1.93 mm |
| 15 | 0.0720″ | 1.83 mm |
| 15.5 | 0.0670″ | 1.70 mm |
| 16 | 0.0625″ | 1.59 mm |
| 17 | 0.0540″ | 1.37 mm |
| 18 | 0.0475″ | 1.21 mm |
| 19 | 0.0410″ | 1.04 mm |
| 20 | 0.0348″ | 0.88 mm |
The primary data point we collect and analyze is coil gauge (wire thickness):
- Coil Gauge – Coils that use a thicker wire (which is a lower gauge number) typically provide better support, durability, and longevity. However, there are other relevant factors including number of turns, intended firmness level, coil placement (edge vs. center vs. zoning), steel quality, number of coils, and coil diameter, among other coil attributes that impact performance. While coil gauge is a useful data point as part of our larger analysis, it is not currently a scoring factor.
Outstanding
≤ 14.0 Gauge
Excellent
14.1-15.0 Gauge
Good
15.1-16.0 Gauge
Fair
16.1-17.0 PCF
Mediocre
17.1-18.0 PCF
Poor
18.1-19.0 PCF
Terrible
> 20.0 PCF
The rating chart above should be considered a general guideline and applies only to large coil units. These ratings are not appropriate for microcoils (which are considerably thinner by design).
Kids Mattress Scoring
To score mattresses for children and kids we use a modified version of our standard scoring system. The modified version drops irrelevant scoring factors, so that we only include factors that could impact the performance of the mattress for children.
Errors & Corrections
Our system of testing and scores is complex, difficult to execute, and difficult to maintain. So there is no question that at times we may execute a test wrong, calculate a score wrong, forget to update a score or analysis, or make other errors.
We make every effort to check and double check our work so that we keep those mistakes to an absolute minimum. But, they will still happen.
If you come across an error, you think or data isn’t right, or see something else that just doesn’t make sense, please let us know here. We will always correct errors and we’re happy to explain anything that needs more clarity.
Suggestions
Do you have a suggestion for how we could make our scoring system better? Please send us your feedback here.