O say, can you see by the dawn’s early light … all the sex Americans had through the night? How often do Americans have sex? Americans in their 20s have sex around 80 times a year, or approximately once every four to five days. This rate declines over time, dropping to about 20 times a year for those in their 60s.
Of course, America is a huge and wildly diverse place, so U.S. sex rates vary. Which states have the most sex? NapLab conducted an American sex survey to unveil where people are getting the most lucky and how often people have sex.
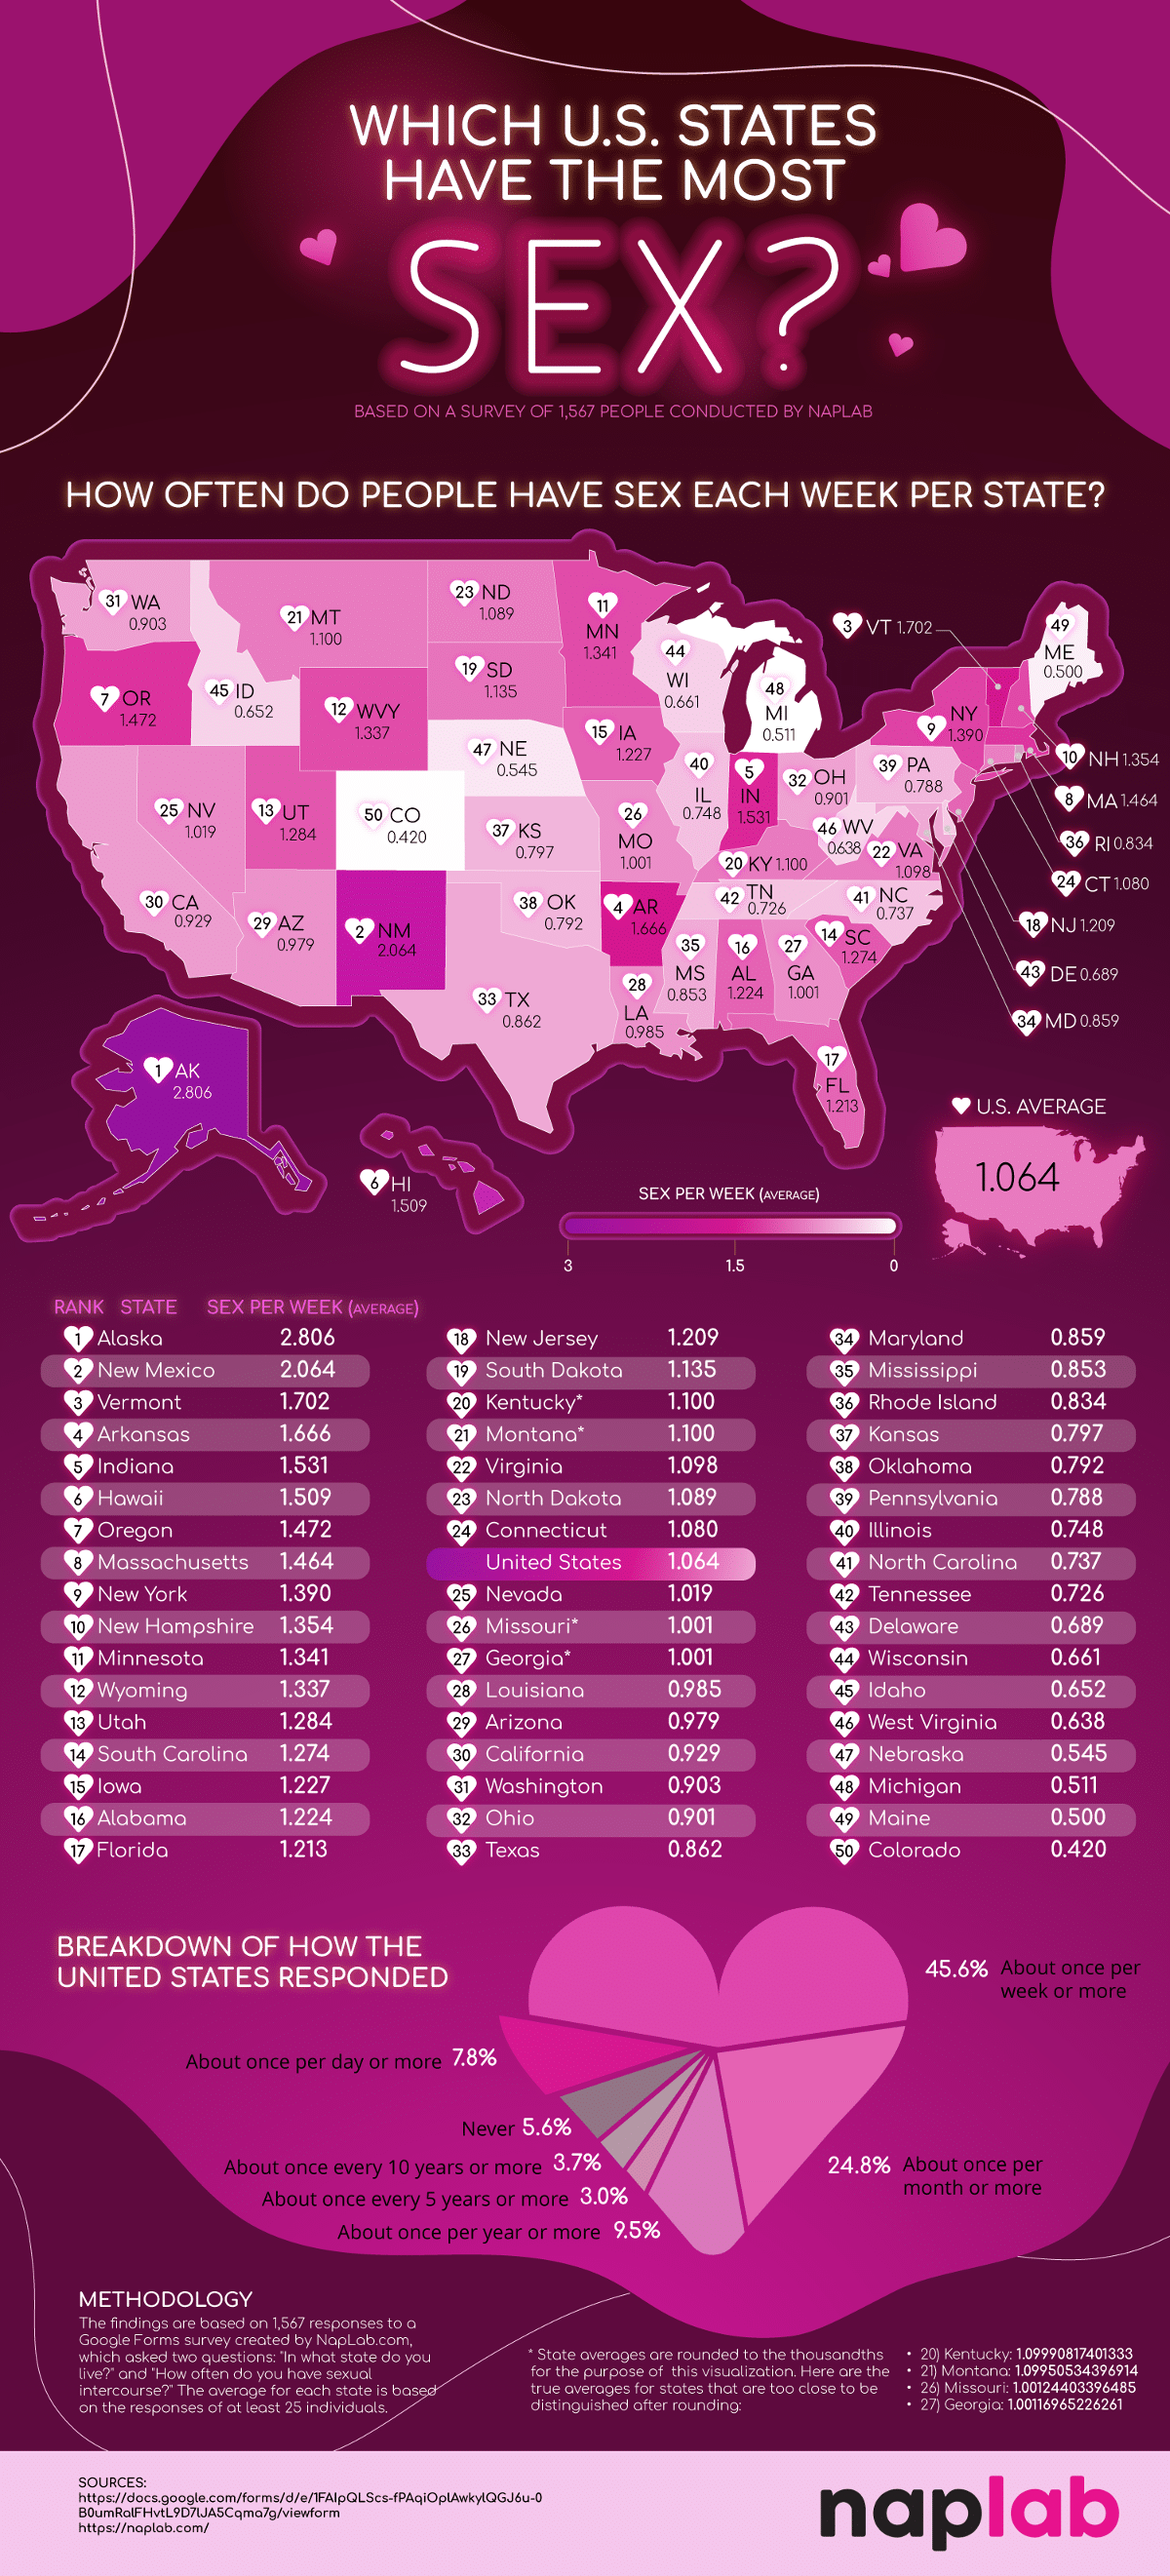
Let’s get down to business and explore the average sex frequency rates by state:
Like this infographic? Share it on your own page with the following code:
<center>
<textarea readonly>
<a href="https://naplab.com/guides/which-us-states-have-the-most-sex/">
<img src="https://media.naplab.com/2023/06/which-states-have-most-sex-4-1200.png" alt="Which U.S. States Have the Most Sex? - NapLab.com Mattress Reviews - Infographic" title="Which U.S. States Have the Most Sex? - NapLab.com - Infographic"></a><br><a href="https://www.NapLab.com" alt="NapLab.com Mattress Reviews" title="NapLab.com">By NapLab.com</a>
</textarea>
</center>
Which States Have the Most Sex?
Where are Americans having the most sex? Here are the top 15 states ranked by average sex frequency per week:
- Alaska — 2.806
- New Mexico — 2.064
- Vermont — 1.702
- Arkansas — 1.666
- Indiana — 1.531
- Hawaii — 1.509
- Oregon — 1.472
- Massachusetts — 1.464
- New York — 1.390
- New Hampshire — 1.354
- Minnesota — 1.341
- Wyoming — 1.337
- Utah — 1.284
- South Carolina — 1.274
- Iowa — 1.227
Way to go, Alaska! With an average winter temperature of 20 to -10 °F, maybe they are having lots of sex just to keep warm.
Which States Have the Least Sex?
Where are Americans having the least sex? Here are the top 15 states with the lowest sex rates:
- Colorado — 0.420
- Maine — 0.500
- Michigan — 0.511
- Nebraska — 0.545
- West Virginia — 0.638
- Idaho — 0.652
- Wisconsin — 0.661
- Delaware — 0.689
- Tennessee — 0.726
- North Carolina — 0.737
- Illinois — 0.748
- Pennsylvania — 0.788
- Oklahoma — 0.792
- Kansas — 0.797
- Rhode Island — 0.834
How often do people have sex according to our survey data?
Of the 1,567 respondents, 7.8% have sex once per day, 45.6% have sex once per week, 24.8% have sex once per month, and 9.5% have sex once per year. The average sex frequency per week in the United States is 1.06.
Are Americans Having Less Sex?
Yes, sex in the United States has been on a steady decline. In fact, 26% of Americans report having no sex at all in 2021 (despite the fact the US is #15 on our most promiscuous countries ranking), and the pandemic is not to blame. As recently as 2018, nearly 25% of Americans reported having no sex in the previous year. Only 39% of Americans reported having intercourse once or more a week, which is a decrease of nearly 12% in two decades. This is slightly less than our 2023 sex survey data indicates, so perhaps that is a promising sign?
It may come as a surprise that people in our youngest adult-age generation, Gen Z, are now less sexually active than adults in their 30s and 40s. Why is Gen Z having less sex? There are many factors to consider. Sex neuroscientist Debra Soh believes that an overall sense of malaise and disillusionment caused by employment difficulties and delayed milestones may be part of it. An excess of screen time in place of real face-to-face interaction may also play a role.
She states:
“Considering that most social interactions for this generation — including hanging out with friends — happen through digital screens, in some cases racking up nine hours a day of screen time a day, there is no doubt in my mind that this technological disconnect is having a profound impact on sexuality. One can easily imagine how to many adolescents and young adults, sex, intimacy, and human connection can become foreign concepts and perhaps even a little intimidating.”
Psychologist Justin J. Lehmiller, Ph.D., believes that sexlessness can be both a symptom and a cause of poor mental health, so while there are some benefits to young people having less sex (lower rates of sexually transmitted infections, unintended pregnancies, and abortions), the decline in sex rates in America may be a cause for concern.
Then again, some people are perfectly happy without sex. But another alarming factor to consider is the overall social disconnect seeping through the nation and the world, something also reflected in changing sleep habits and statistics across age groups and regions.
In May 2023, the Surgeon General issued a dire warning about the devastating effects of the loneliness epidemic in the United States — around 50% of Americans experience measurable levels of loneliness.
What Is the Best Mattress for Sex?
Perhaps the right mattress will help lead to more sexy time — did you know that NapLab factors sex into our mattress reviews? Our sex score incorporates five key factors — sex bounce (65%), edge support (20%), noise (5%), pressure relief (5%), and cooling (5%).
Yes, sex bounce is THAT important! While a bouncy mattress may not be ideal for sleeping, it is almost always preferable for sex. A good bounce contributes to more “motion in the ocean”!
You can see the 7 best mattress for sex with our data-driven ranking system.
Which U.S. States Have the Most Sex?
We surveyed 1,567 people, and we found that on average, Americans have sex 1.064 times per week. Here’s what we found:
How Often Do People Have Sex Each Week by State?
| Rank | State | Frequency of Sex per Week (Average) |
| 1 | Alaska | 2.806 |
| 2 | New Mexico | 2.064 |
| 3 | Vermont | 1.702 |
| 4 | Arkansas | 1.666 |
| 5 | Indiana | 1.531 |
| 6 | Hawaii | 1.509 |
| 7 | Oregon | 1.472 |
| 8 | Massachusetts | 1.464 |
| 9 | New York | 1.390 |
| 10 | New Hampshire | 1.354 |
| 11 | Minnesota | 1.341 |
| 12 | Wyoming | 1.337 |
| 13 | Utah | 1.284 |
| 14 | South Carolina | 1.274 |
| 15 | Iowa | 1.227 |
| 16 | Alabama | 1.224 |
| 17 | Florida | 1.213 |
| 18 | New Jersey | 1.209 |
| 19 | South Dakota | 1.135 |
| 20 | Kentucky* | 1.100 |
| 21 | Montana* | 1.100 |
| 22 | Virginia | 1.098 |
| 23 | North Dakota | 1.089 |
| 24 | Connecticut | 1.080 |
| United States | 1.064 | |
| 25 | Nevada | 1.019 |
| 26 | Missouri* | 1.001 |
| 27 | Georgia* | 1.001 |
| 28 | Louisiana | 0.985 |
| 29 | Arizona | 0.979 |
| 30 | California | 0.929 |
| 31 | Washington | 0.903 |
| 32 | Ohio | 0.901 |
| 33 | Texas | 0.862 |
| 34 | Maryland | 0.859 |
| 35 | Mississippi | 0.853 |
| 36 | Rhode Island | 0.834 |
| 37 | Kansas | 0.797 |
| 38 | Oklahoma | 0.792 |
| 39 | Pennsylvania | 0.788 |
| 40 | Illinois | 0.748 |
| 41 | North Carolina | 0.737 |
| 42 | Tennessee | 0.726 |
| 43 | Delaware | 0.689 |
| 44 | Wisconsin | 0.661 |
| 45 | Idaho | 0.652 |
| 46 | West Virginia | 0.638 |
| 47 | Nebraska | 0.545 |
| 48 | Michigan | 0.511 |
| 49 | Maine | 0.500 |
| 50 | Colorado | 0.420 |
Breakdown of How the United States Responded
| How Often Do You Have Sexual Intercourse? | Percentage of Total Responses |
| About once per day or more | 7.8% |
| About once per week or more | 45.6% |
| About once per month or more | 24.8% |
| About once per year or more | 9.5% |
| About once every 5 years or more | 3.0% |
| About once every 10 years or more | 3.7% |
| Never | 5.6% |
* State averages are rounded to the thousandths for the purpose of this visualization. Here are the true averages for states that are too close to be distinguished after rounding:
- 20) Kentucky: 1.09990817401333
- 21) Montana: 1.09950534396914
- 26) Missouri: 1.00124403396485
- 27) Georgia: 1.00116965226261
Methodology
The findings are based on 1,567 responses to a Google Forms survey created by NapLab that asked two questions: “In what state do you live?” and “How often do you have sexual intercourse?” The average for each state is based on the responses of at least 25 individuals.