If you’re not currently getting enough sleep, you’re far from alone. According to the CDC, one in three adults in the US have reported not getting enough sleep every day. Poor quality sleep has been normalized in our culture as a whole, but some areas more than others.
The NapLab team created the Sleep Quality Index to study each state’s sleep norms. If you’re in one of the states with the least quality sleep on average, then you might need to be the one to begin the change.
Like this infographic? Share it on your own page with the following code:
<center>
<textarea readonly>
<a href="https://naplab.com/guides/which-states-get-the-best-quality-sleep/">
<img src="https://media.naplab.com/2024/06/states-best-quality-sleep-8.png alt="Which States Get the Best Quality Sleep? - NapLap Mattress Reviews - Infographic" title="Which States Get the Best Quality Sleep? - NapLap.com - Infographic"></a><br><a href="https://www.NapLap.com" alt="NapLap Mattress Reviews" title="NapLap.com">By NapLap.com</a>
</textarea>
</center>
Which state gets the best sleep?
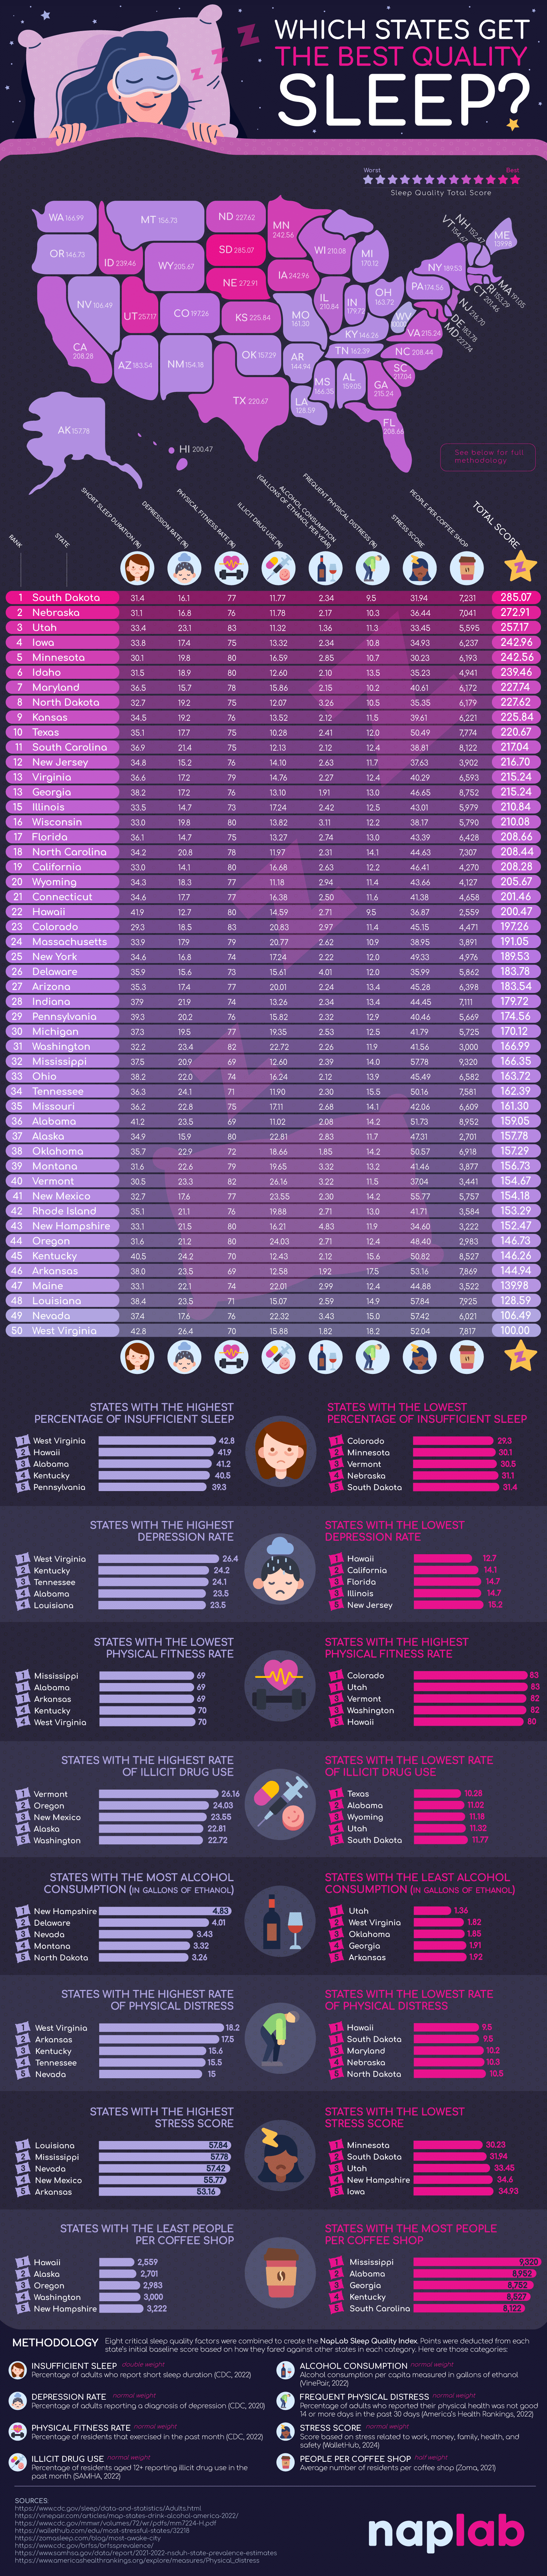
According to our sleep quality index, which measures a range of factors from sleep duration to stress scores, South Dakota is getting the best sleep in the country, with fewer people reporting insufficient sleep, a lower stress score, and lower reported depression rates than much of the country.
The Top Ten States with the Best Quality Sleep
- South Dakota
- Nebraska
- Utah
- Idaho
- Minnesota
- Iowa
- New Jersey
- Hawaii
- California
- Maryland
Which state gets the worst sleep?
West Virginia scored last on our sleep quality index, reporting short average sleep durations, high depression rates, and high amounts of reported physical distress.
The Top Ten States with the Worst Quality Sleep
- West Virginia
- Nevada
- Louisiana
- Kentucky
- Arkansas
- Alabama
- Mississippi
- Tennessee
- Oklahoma
- Missouri
What is “quality” sleep?
While sleep duration is an important factor, several others relate to quality: sleep efficiency (the percentage of “sleep” time actually sleeping), sleep latency (the time it takes to go from wakefulness to the earliest sleep stages), and wake after sleep onset (the number of minutes that a person is awake after having fallen asleep) are all important factors to consider in the subjective experience of quality sleep.
How did we measure sleep quality?
Our methodology for measuring sleep quality in various states takes into account reported insufficient sleep duration as well as some of the top factors that negatively affect sleep quality (such as psychological problems, stress, drug use, and heavy caffeine consumption) as well as those that positively affect sleep efficiency (such as physical fitness).
Our Sleep Quality Index
- Insufficient Sleep: Percentage of adults who report short sleep duration (2022)
- Depression Rate: Percentage of adults reporting a diagnosis of depression (2020)
- Physical Fitness Rate: Percentage of residents that exercised in the past month (2022)
- Illicit Drug Use: Percentage of residents aged 12+ reporting illicit drug use in the past month (2022)
- Alcohol Consumption: Alcohol consumption per capita measured in gallons of ethanol (2022)
- Frequent Physical Distress: Percentage of adults who reported their physical health was not good 14 or more days in the past 30 days (2022)
- Stress Score: Score based on stress related to work, money, family, health, and safety (2024)
- People Per Coffee Shop: Average number of residents per coffee shop (2021)
What is the average amount of sleep by state?
We conducted a survey of the average sleep by state and found that South Dakota (again!) gets the most sleep in the US. What state gets the least amount of sleep? Hawaii scored the lowest in terms of sleep duration, but much better in terms of sleep quality.
How many hours of sleep do Americans get?
According to a recent WebMD survey, the average time Americans spend in bed was 7.61 hours; however, they also found that having a “fitful” night’s rest is extremely common. According to the study, 36 percent of those surveyed spent 5.7 hours per night actually asleep. So, while some have stayed in bed for the appropriate amount of time, many of us are still lacking in getting a “quality” night’s rest. This just shows again the difference between sleep duration and quality.
Why does having quality sleep matter?
The science is clear: It’s not just about getting sleep, but getting better sleep in longer durations and with fewer interruptions.
- When compared with those who slept nine hours per night, those who slept only six hours had a 20% higher chance of a heart attack.
- A meta-analysis found that adequate sleep duration (at least seven or eight hours per night) was vital for preventing hypertension and diabetes mellitus, both of which often lead to cardiovascular issues.
- There is a strong link between “slow-wave” sleep and your immune system.
- Studies have suggested that even springing forward only one hour on daylight saving time leads to an uptick of heart attacks and strokes in America.
- According to the National Institute for Health, undiagnosed sleep apnea by itself costs America $150 billion per year.
- Besides heart disease and strokes, sleep deficiency has been linked to kidney problems, obesity, diabetes, and depression.
How does one get quality sleep?
You can get quality sleep by practicing good sleep hygiene. Here are our sleep hygiene tips:
- Wake up at a consistent time. For most people, having a strict, consistent schedule of seven to eight hours every day is the secret of how to improve sleep quality. Some have more success with a polyphasic sleep schedule, but they sometimes come with instability and other risk factors.
- Have a consistent nightly routine. This should include a half-hour “wind down” time with no screens before bed.
- Don’t use your phone or watch TV in bed. Many suggest keeping your bed a “sleep-only” zone. In other words, don’t check emails, don’t watch movies, don’t send texts, and don’t otherwise hang out there unless sleep is part of the plan.
- Reduce caffeine, alcohol, tobacco, or drug consumption during the day. All of these substances can negatively affect your sleep, especially caffeine and cigarettes, which is why we factored them into our index.
- Exercise during the day. While you might not want to exercise right before sleeping, it’s best to exercise moderately during the day so that you’ll feel more tired at night.
- Find the right bed and accessories for your sleeping style. Those who sleep on their backs, for instance, will want a firmer mattress and a memory foam pillow. To find the best mattress for you, check out our in-depth mattress comparisons and mattress reviews.
- If you’re applying these tips consistently and still having issues, seek a sleep diagnosis. Don’t bother wondering how to get quality sleep if you’re struggling with, for instance, sleep apnea, a nightmare disorder, narcolepsy, or even PTSD.
Our Ranking of Quality Sleep by State
| Rank | State | Short Sleep Duration (%) | Depression Rate (%) | Physical Fitness Rate (%) | Illicit Drug Use (%) | Alcohol Consumption (Gallons of Ethanol per Year) | Frequent Physical Distress (%) | Stress Score | People per Coffee Shop | TOTAL SCORE |
| 1 | South Dakota | 31.4 | 16.1 | 77 | 11.77 | 2.34 | 9.5 | 31.94 | 7,231 | 285.07 |
| 2 | Nebraska | 31.1 | 16.8 | 76 | 11.78 | 2.17 | 10.3 | 36.44 | 7,041 | 272.91 |
| 3 | Utah | 33.4 | 23.1 | 83 | 11.32 | 1.36 | 11.3 | 33.45 | 5,595 | 257.17 |
| 6 | Iowa | 33.8 | 17.4 | 75 | 13.32 | 2.34 | 10.8 | 34.93 | 6,237 | 242.96 |
| 5 | Minnesota | 30.1 | 19.8 | 80 | 16.59 | 2.85 | 10.7 | 30.23 | 6,193 | 242.56 |
| 4 | Idaho | 31.5 | 18.9 | 80 | 12.6 | 2.1 | 13.5 | 35.23 | 4,941 | 239.46 |
| 10 | Maryland | 36.5 | 15.7 | 78 | 15.86 | 2.15 | 10.2 | 40.61 | 6,172 | 227.74 |
| 12 | North Dakota | 32.7 | 19.2 | 75 | 12.07 | 3.26 | 10.5 | 35.35 | 6,179 | 227.62 |
| 13 | Kansas | 34.5 | 19.2 | 76 | 13.52 | 2.12 | 11.5 | 39.61 | 6,221 | 225.84 |
| 21 | Texas | 35.1 | 17.7 | 75 | 10.28 | 2.41 | 12 | 50.49 | 7,774 | 220.67 |
| 25 | South Carolina | 36.9 | 21.4 | 75 | 12.13 | 2.12 | 12.4 | 38.81 | 8,122 | 217.04 |
| 7 | New Jersey | 34.8 | 15.2 | 76 | 14.1 | 2.63 | 11.7 | 37.63 | 3,902 | 216.7 |
| 19 | Virginia | 36.6 | 17.2 | 79 | 14.76 | 2.27 | 12.4 | 40.29 | 6,593 | 215.24 |
| 27 | Georgia | 38.2 | 17.2 | 76 | 13.1 | 1.91 | 13 | 46.65 | 8,752 | 215.24 |
| 18 | Illinois | 33.5 | 14.7 | 73 | 17.24 | 2.42 | 12.5 | 43.01 | 5,979 | 210.84 |
| 17 | Wisconsin | 33 | 19.8 | 80 | 13.82 | 3.11 | 12.2 | 38.17 | 5,790 | 210.08 |
| 20 | Florida | 36.1 | 14.7 | 75 | 13.27 | 2.74 | 13 | 43.39 | 6,428 | 208.66 |
| 24 | North Carolina | 34.2 | 20.8 | 78 | 11.97 | 2.31 | 14.1 | 44.63 | 7,307 | 208.44 |
| 9 | California | 33 | 14.1 | 80 | 16.68 | 2.63 | 12.2 | 46.41 | 4,270 | 208.28 |
| 11 | Wyoming | 34.3 | 18.3 | 77 | 11.18 | 2.94 | 11.4 | 43.66 | 4,127 | 205.67 |
| 14 | Connecticut | 34.6 | 17.7 | 77 | 16.38 | 2.5 | 11.6 | 41.38 | 4,658 | 201.46 |
| 8 | Hawaii | 41.9 | 12.7 | 80 | 14.59 | 2.71 | 9.5 | 36.87 | 2,559 | 200.47 |
| 16 | Colorado | 29.3 | 18.5 | 83 | 20.83 | 2.97 | 11.4 | 45.15 | 4,471 | 197.26 |
| 15 | Massachusetts | 33.9 | 17.9 | 79 | 20.77 | 2.62 | 10.9 | 38.95 | 3,891 | 191.05 |
| 22 | New York | 34.6 | 16.8 | 74 | 17.24 | 2.22 | 12 | 49.33 | 4,976 | 189.53 |
| 28 | Delaware | 35.9 | 15.6 | 73 | 15.61 | 4.01 | 12 | 35.99 | 5,862 | 183.78 |
| 32 | Arizona | 35.3 | 17.4 | 77 | 20.01 | 2.24 | 13.4 | 45.28 | 6,398 | 183.54 |
| 37 | Indiana | 37.9 | 21.9 | 74 | 13.26 | 2.34 | 13.4 | 44.45 | 7,111 | 179.72 |
| 35 | Pennsylvania | 39.3 | 20.2 | 76 | 15.82 | 2.32 | 12.9 | 40.46 | 5,669 | 174.56 |
| 36 | Michigan | 37.3 | 19.5 | 77 | 19.35 | 2.53 | 12.5 | 41.79 | 5,725 | 170.12 |
| 23 | Washington | 32.2 | 23.4 | 82 | 22.72 | 2.26 | 11.9 | 41.56 | 3,000 | 166.99 |
| 44 | Mississippi | 37.5 | 20.9 | 69 | 12.6 | 2.39 | 14 | 57.78 | 9,320 | 166.35 |
| 39 | Ohio | 38.2 | 22 | 74 | 16.24 | 2.12 | 13.9 | 45.49 | 6,582 | 163.72 |
| 43 | Tennessee | 36.3 | 24.1 | 71 | 11.9 | 2.3 | 15.5 | 50.16 | 7,581 | 162.39 |
| 41 | Missouri | 36.2 | 22.8 | 75 | 17.11 | 2.68 | 14.1 | 42.06 | 6,609 | 161.3 |
| 45 | Alabama | 41.2 | 23.5 | 69 | 11.02 | 2.08 | 14.2 | 51.73 | 8,952 | 159.05 |
| 26 | Alaska | 34.9 | 15.9 | 80 | 22.81 | 2.83 | 11.7 | 47.31 | 2,701 | 157.78 |
| 42 | Oklahoma | 35.7 | 22.9 | 72 | 18.66 | 1.85 | 14.2 | 50.57 | 6,918 | 157.29 |
| 31 | Montana | 31.6 | 22.6 | 79 | 19.65 | 3.32 | 13.2 | 41.46 | 3,877 | 156.73 |
| 30 | Vermont | 30.5 | 23.3 | 82 | 26.16 | 3.22 | 11.5 | 37.04 | 3,441 | 154.67 |
| 40 | New Mexico | 32.7 | 17.6 | 77 | 23.55 | 2.3 | 14.2 | 55.77 | 5,757 | 154.18 |
| 33 | Rhode Island | 35.1 | 21.1 | 76 | 19.88 | 2.71 | 13 | 41.71 | 3,584 | 153.29 |
| 29 | New Hampshire | 33.1 | 21.5 | 80 | 16.21 | 4.83 | 11.9 | 34.6 | 3,222 | 152.47 |
| 34 | Oregon | 31.6 | 21.2 | 80 | 24.03 | 2.71 | 12.4 | 48.4 | 2,983 | 146.73 |
| 47 | Kentucky | 40.5 | 24.2 | 70 | 12.43 | 2.12 | 15.6 | 50.82 | 8,527 | 146.26 |
| 46 | Arkansas | 38 | 23.5 | 69 | 12.58 | 1.92 | 17.5 | 53.16 | 7,869 | 144.94 |
| 38 | Maine | 33.1 | 22.1 | 74 | 22.01 | 2.99 | 12.4 | 44.88 | 3,522 | 139.98 |
| 48 | Louisiana | 38.4 | 23.5 | 71 | 15.07 | 2.59 | 14.9 | 57.84 | 7,925 | 128.59 |
| 49 | Nevada | 37.4 | 17.6 | 76 | 22.32 | 3.43 | 15 | 57.42 | 6,021 | 106.49 |
| 50 | West Virginia | 42.8 | 26.4 | 70 | 15.88 | 1.82 | 18.2 | 52.04 | 7,817 | 100 |
The 5 States with the Highest Percentage of Insufficient Sleep
- West Virginia: 42.8
- Hawaii: 41.9
- Alabama: 41.2
- Kentucky: 40.5
- Pennsylvania: 39.3
The 5 States with the Lowest Percentage of Insufficient Sleep
- Colorado: 29.3
- Minnesota: 30.1
- Vermont: 30.5
- Nebraska: 31.1
- South Dakota: 31.4
The 5 States with the Highest Depression Rate
- West Virginia: 26.4
- Kentucky: 24.2
- Tennessee: 24.1
- Alabama: 23.5
- Louisiana: 23.5
The 5 States with the Lowest Depression Rate
- Hawaii: 12.7
- California: 14.1
- Florida: 14.7
- Illinois: 14.7
- New Jersey: 15.2
The 5 States with the Lowest Physical Fitness Rate
- Mississippi: 69
- Alabama: 69
- Arkansas: 69
- Kentucky: 70
- West Virginia: 70
The 5 States with the Highest Physical Fitness Rate
- Colorado: 83
- Utah: 83
- Vermont: 82
- Washington: 82
- Hawaii: 80
The 5 States with the Highest Rate of Illicit Drug Use
- Vermont: 26.16
- Oregon: 24.03
- New Mexico: 23.55
- Alaska: 22.81
- Washington: 22.72
The 5 States with the Lowest Rate of Illicit Drug Use
- Texas: 10.28
- Alabama: 11.02
- Wyoming: 11.18
- Utah: 11.32
- South Dakota: 11.77
The 5 States with the Most Alcohol Consumption (in gallons of ethanol)
- New Hampshire: 4.83
- Delaware: 4.01
- Nevada: 3.43
- Montana: 3.32
- North Dakota: 3.26
The 5 States with the Least Alcohol Consumption (in gallons of ethanol)
- Utah: 1.36
- West Virginia: 1.82
- Oklahoma: 1.85
- Georgia: 1.91
- Arkansas: 1.92
The 5 States with the Highest Rate of Physical Distress
- West Virginia: 18.2
- Arkansas: 17.5
- Kentucky: 15.6
- Tennessee: 15.5
- Nevada: 15
The 5 States with the Lowest Rate of Physical Distress
- Hawaii: 9.5
- South Dakota: 9.5
- Maryland: 10.2
- Nebraska: 10.3
- North Dakota: 10.5
The 5 States with the Highest Stress Score
- Louisiana: 57.84
- Mississippi: 57.78
- Nevada: 57.42
- New Mexico: 55.77
- Arkansas: 53.16
The 5 States with the Lowest Stress Score
- Minnesota: 30.23
- South Dakota: 31.94
- Utah: 33.45
- New Hampshire: 34.6
- Iowa: 34.93
The 5 States with the Least People per Coffee Shop
- Hawaii: 2,559
- Alaska: 2,701
- Oregon: 2,983
- Washington: 3,000
- New Hampshire: 3,222
The 5 States with the Most People per Coffee Shop
- Mississippi: 9,320
- Alabama: 8,952
- Georgia: 8,752
- Kentucky: 8,527
- South Carolina: 8,122