Ever had one of those nights where you wake up in a cold sweat, heart pounding, convinced something was lurking just beyond the shadows? While nightmares can strike anywhere, some cities might just be more primed to feed your subconscious fears. Whether it’s an unusual number of ghost sightings, too many haunted houses, or rampant sleep deprivation, certain places in the U.S. come packed with factors that could leave your dreams anything but peaceful.
To find out which cities might be fueling the most restless nights, we looked at 14 eerie-but-everyday culprits: things like alien sightings, venomous snake species, and the percentage of residents running on too little sleep. But don’t panic or pack your bags just yet—even though this list is rooted in real data and weighted rankings, it’s all analyzed in the spirit of fun. While we didn’t consult any dream experts or ghost hunters, we’re pretty sure a good night’s sleep still starts with a comfy mattress and a relaxing nightly routine, no matter where you are!
Which U.S. Cities Are the Most Likely to Give You Nightmares?
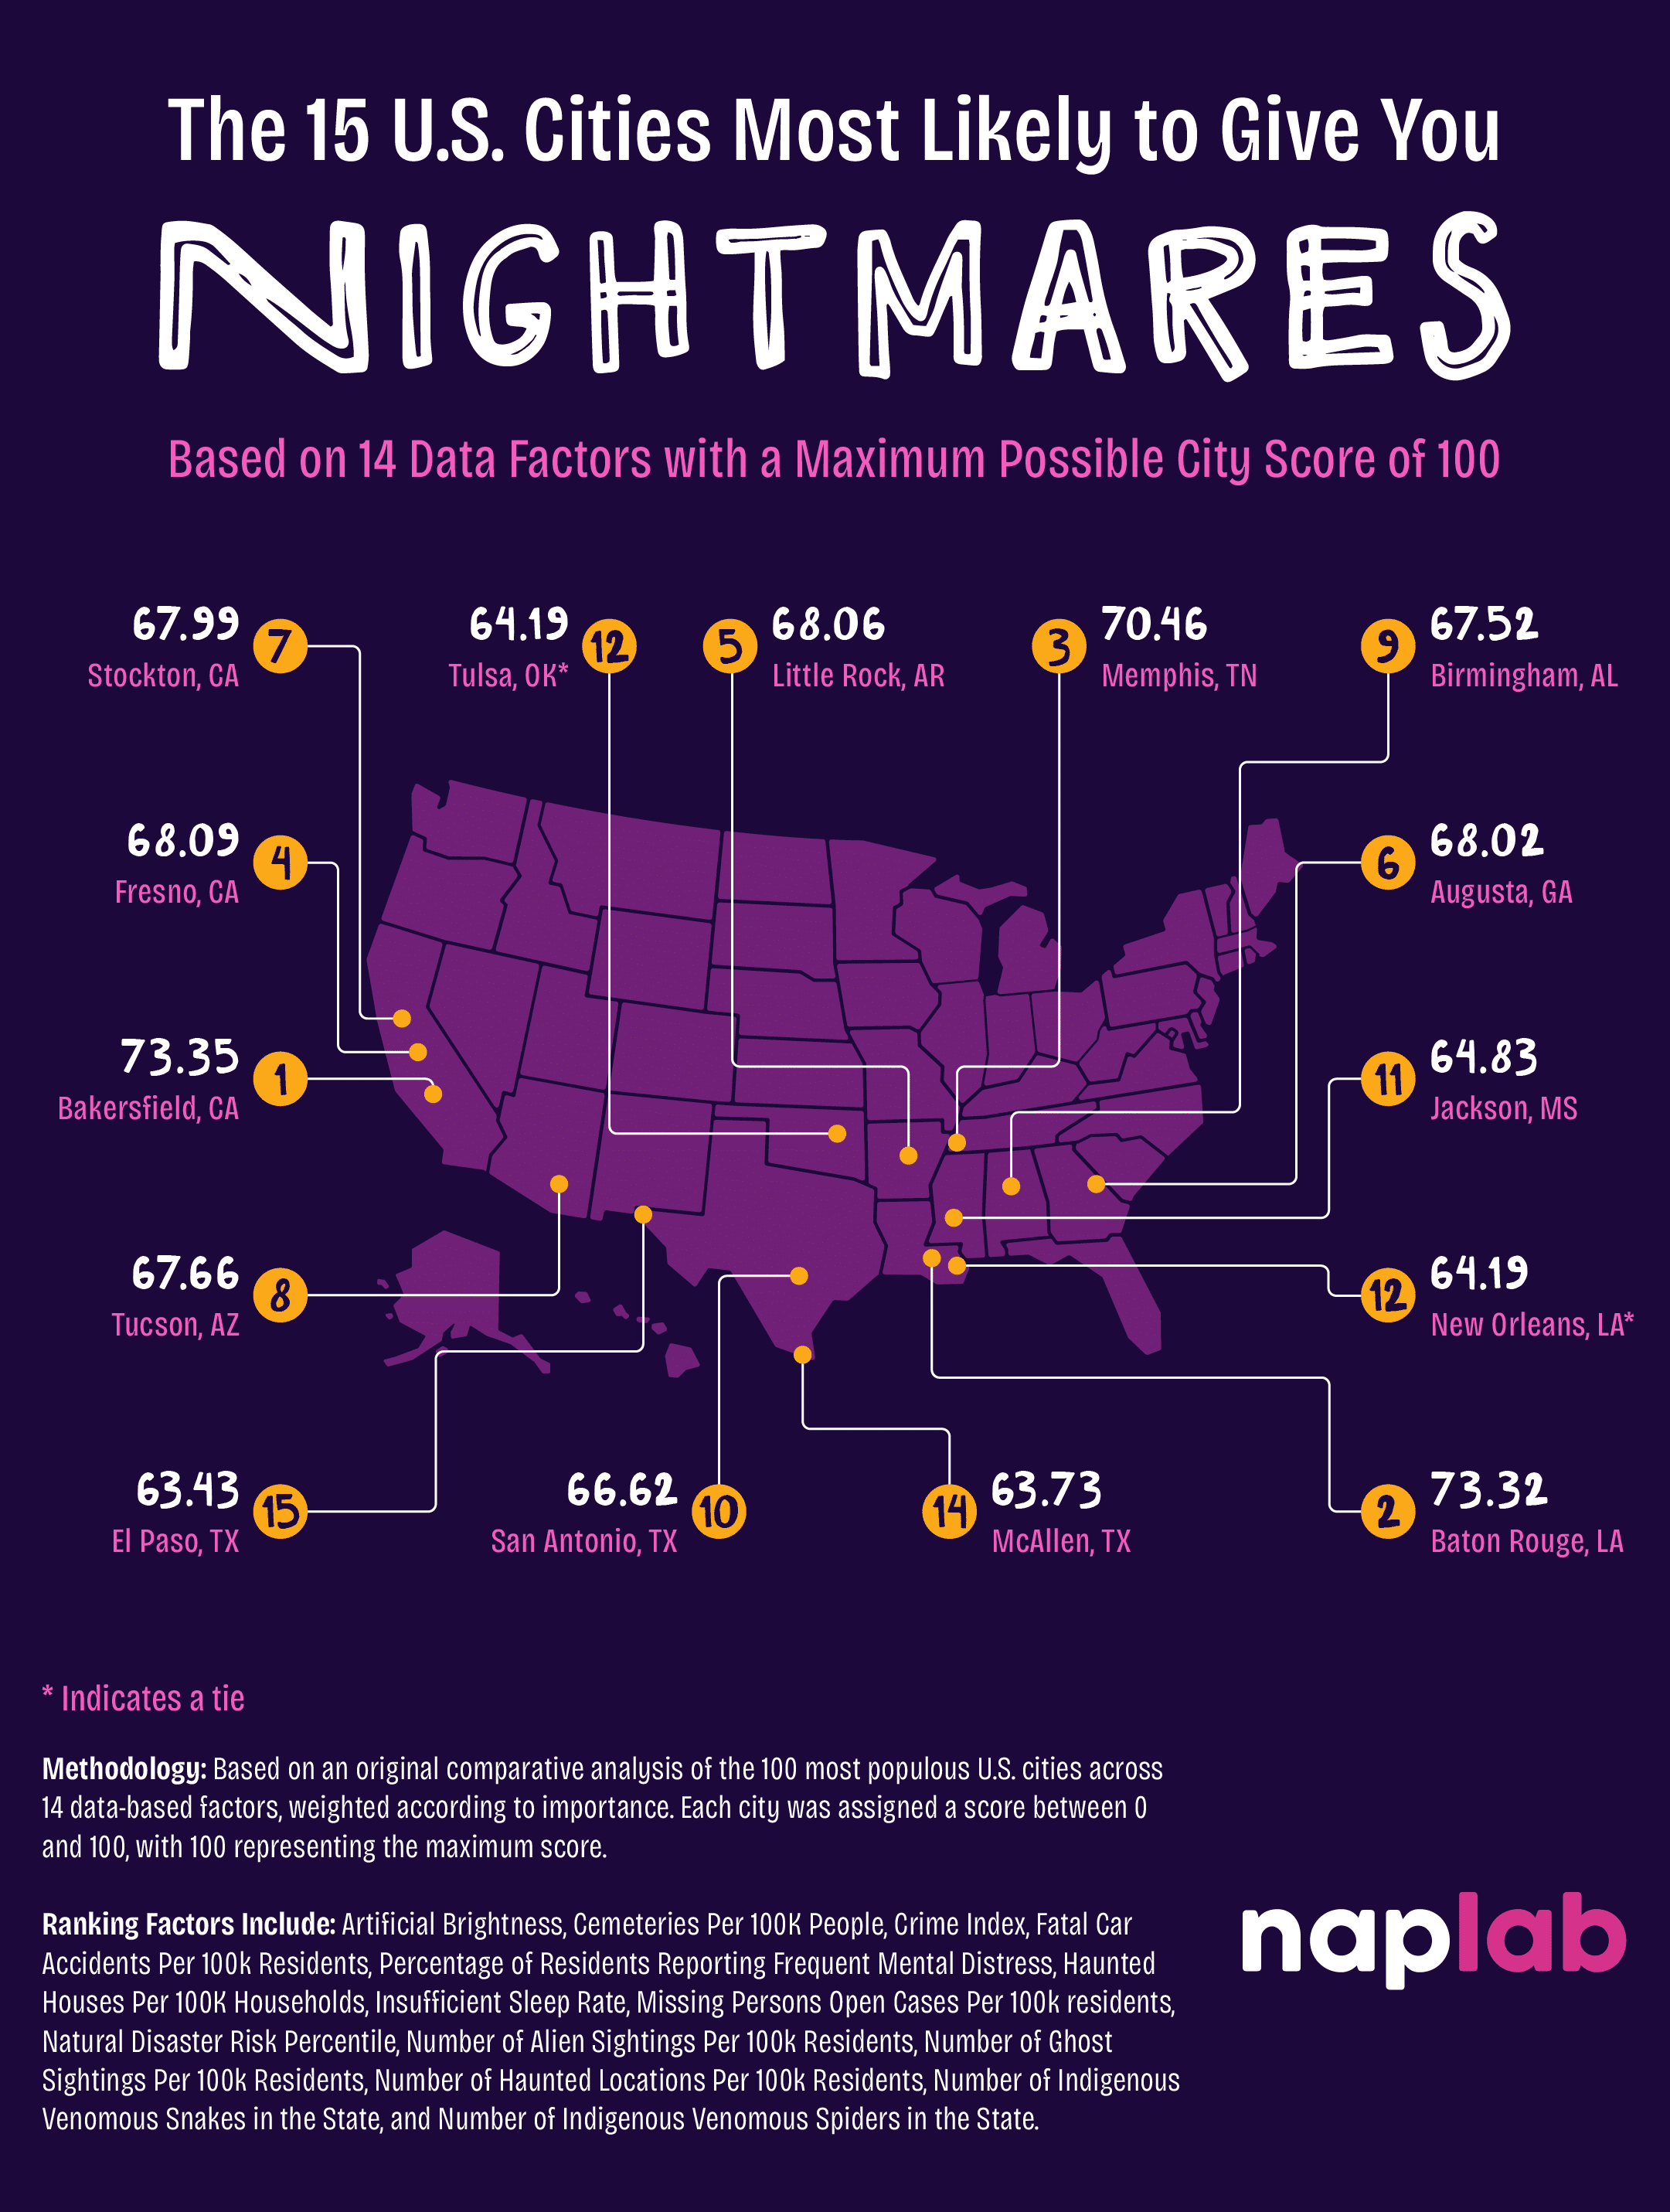
If you’re looking for peaceful dreams, some cities may stack the odds against you. Bakersfield, California, landed the top spot with a total score of 73.35, edging out Baton Rouge, Louisiana, by just a hair. Memphis, Tennessee, rounded out the top three, followed closely by cities in California, Arkansas, and Georgia. Notably, California appears three times within the top seven, making it one of the most nightmare-dense states on the list.
Cities in the South and Southwest also showed strong potential for nightmares, with Tucson, Arizona; San Antonio, Texas; and Birmingham, Alabama, all making the top 10. Interestingly, each of the top 15 cities almost entirely falls in the lower half of the country. Everyone must sleep soundly in the North!
Top 15 U.S. Cities Most Likely to Give You Nightmares
- Bakersfield, California – 73.35
- Baton Rouge, Louisiana – 73.32
- Memphis, Tennessee – 70.46
- Fresno, California – 68.09
- Little Rock, Arkansas – 68.06
- Augusta, Georgia – 68.02
- Stockton, California – 67.99
- Tucson, Arizona – 67.66
- Birmingham, Alabama – 67.52
- San Antonio, Texas – 66.62
- Jackson, Mississippi – 64.83
- New Orleans, Louisiana – 64.19*
- Tulsa, Oklahoma – 64.19*
- McAllen, Texas – 63.73
- El Paso, Texas – 63.43
*Indicates a tie
The Full Nightmarish Data
When you peer into each factor, some cities emerge as specialists in particular nightmare-inducing categories.
- El Paso, Texas, has the most ghost sightings per capita at 23 per 100k residents.
- The most venomous spider species call Texas home, and the most venomous snake species are native to Arizona.
- Tulsa, Oklahoma, is home to the most haunted houses per capita at 531 per 100k housing units.
- The highest portion of residents (50%) in the study report getting the least amount of sleep in Honolulu, Hawaii.
This is just a peek of the full picture. Dive into the full dataset and see how your city stacks up … if you dare!
“We’re always exploring the intersection of sleep and environment, including what helps us rest and what keeps us up at night. This study was a fun way to shine a light on the less obvious factors that might disrupt our sleep. Whether it’s noise, stress, or something a little more—unusual—it’s always interesting to discover how sleep can vary by location.” Derek Hales, founder & editor-in-chief of NapLab
Closing Thoughts
From paranormal sightings to venomous creatures, plenty of nightmarish thoughts might creep into your sleep. And depending on where you live, you might come into contact with nightmare-inducing experiences in some cities more than others. Luckily, a strong sleep schedule, good stress management, and a comfortable sleep space can help you get back to resting as quickly as possible.
At NapLab, our biggest nighttime fear is tossing and turning on a mattress that just doesn’t cut it. While we can’t control ghost sightings or the number of cemeteries in your city, we can help you find a mattress that supports better sleep. Check out our expert mattress reviews to find top-rated mattresses built for peace of mind and uninterrupted rest.
Methodology
To determine the U.S. cities most likely to give you nightmares, we comparatively analyzed the 100 most populous U.S. cities across 14 spooky, data-based factors that could keep you squirming in bed, weighted according to importance. Each city was given a score totaling between 0 and 100, with 100 representing the maximum score.
Check out the full list of data sources:
| Ranking Factor | Weight | Connection to Causing Nightmares | Source |
|---|---|---|---|
| Insufficient Sleep | 2.5 | Sleep Deprivation | County Health Rankings |
| Crime Index | 2.0 | Common Fear | Neighborhood Scout |
| % of Residents With Frequent Mental Distress | 2.0 | High Stress | County Health Rankings |
| Natural Disaster Risk | 2.0 | Common Fear | FEMA |
| Fatal Car Accidents Per 100k Residents | 1.5 | Common Fear | NHTSA |
| Haunted Houses Per 100K Housing Units | 1.5 | Paranormal Activity | Housecreep |
| Missing Persons Open Cases Per 100k Residents | 1.5 | Common Fear | NAMUS |
| Artificial Brightness | 1.0 | Common Fear (Darkness) | Light Pollution Map |
| Cemeteries Per 100K Residents | 1.0 | Paranormal Activity | Find a Grave |
| Number of Alien Sightings Per 100k Residents | 1.0 | Paranormal Activity | NUFORC |
| Number of Ghost Sightings Per 100k Residents | 1.0 | Paranormal Activity | Ghosts of America |
| Number of Haunted Locations Per 100k Residents | 1.0 | Paranormal Activity | Fright Find |
| Number of Indigenous Venomous Snakes in the State | 1.0 | Common Fear | Venombyte |
| Number of Indigenous Venomous Spiders in the State | 1.0 | Common Fear | Venombyte |
Fair Use
You are welcome to use, reference, and share non-commercial excerpts of this study with proper attribution. If you cite or cover our findings, please link back to this page so readers can view the full methodology, charts, and context.